
Bestand:Characterization of the SOX2T-positive territory of the epiblast in chicken embryo.jpg
Oorspronkelijk bestand (2.113 × 1.581 pixels, bestandsgrootte: 1,21 MB, MIME-type: image/jpeg)
| Dit is een bestand van Wikimedia Commons. Onderstaande beschrijving komt van de beschrijving van het bestand daar. |
Beschrijving
| Beschrijving |
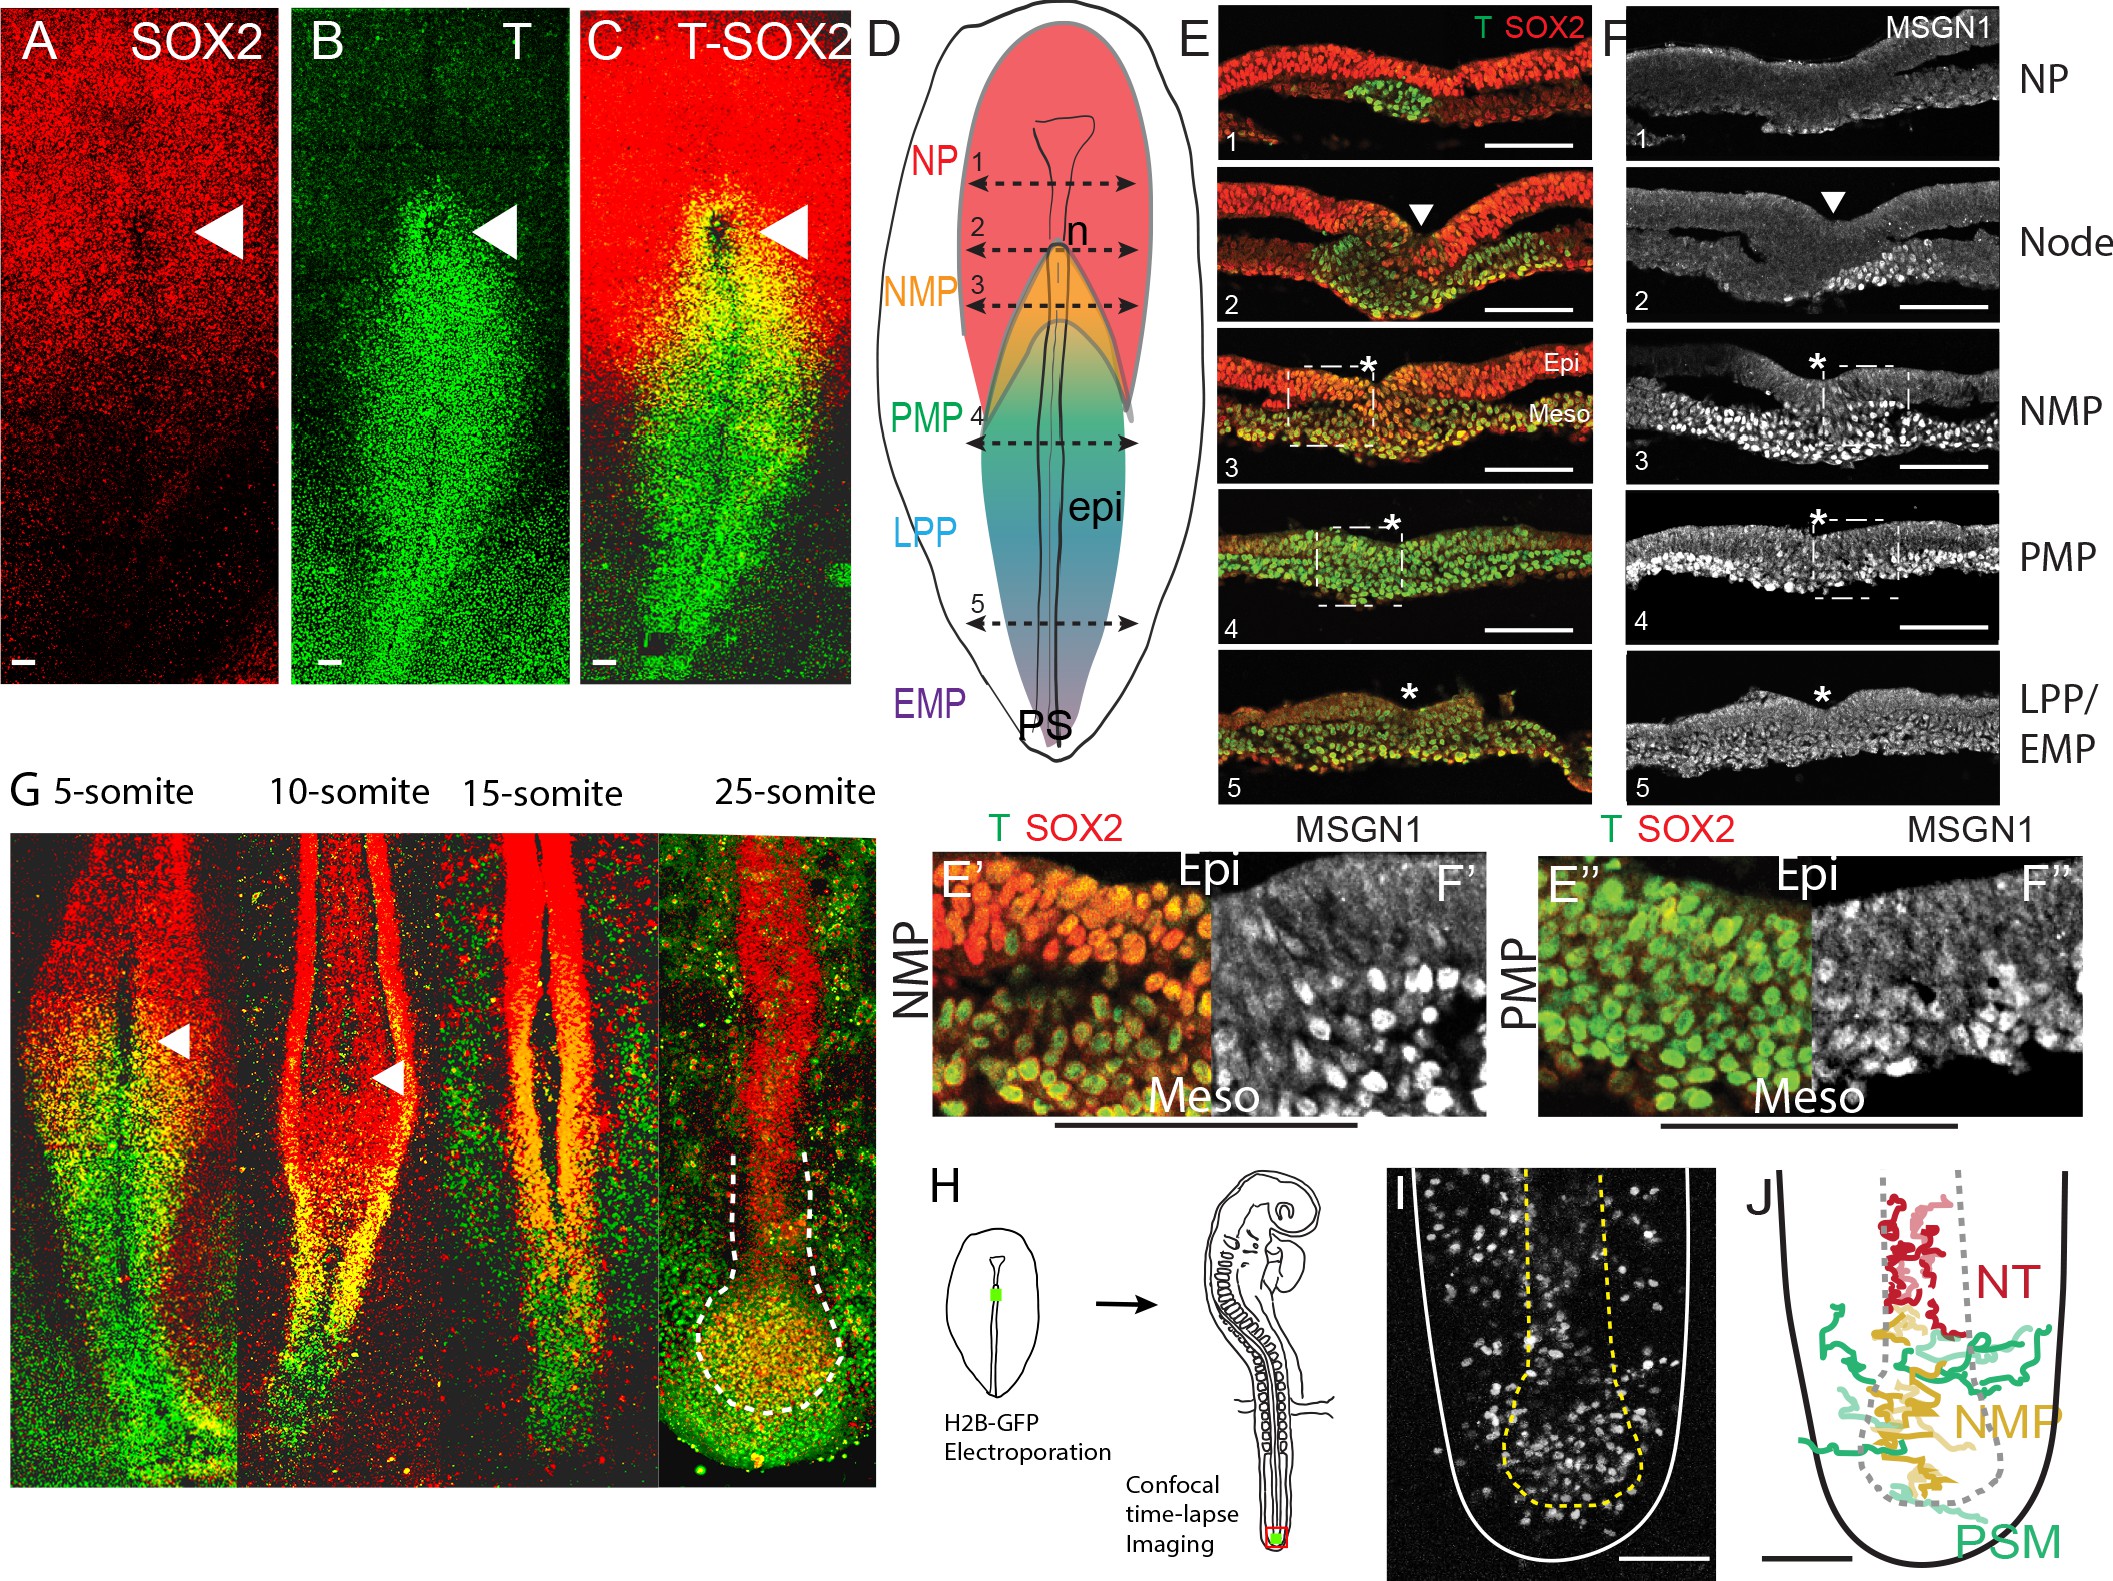
Fig. 1. Characterization of the SOX2/T-positive territory of the epiblast. |
| Datum | |
| Bron |
https://iiif.elifesciences.org/lax/64819%2Felife-64819-fig1-v2.tif/full/1500,/0/default.jpg https://doi.org/10.7554/eLife.64819 Dynamics of primitive streak regression controls the fate of neuromesodermal progenitors in the chicken embryo eLife 10:e64819. |
| Auteur | Charlene Guillot Yannis Djeffal Arthur Michaut Brian Rabe Olivier Pourquié |

|
Dit bestand, dat oorspronkelijk toegevoegd was op een externe website, is nog niet beoordeeld door een moderator of reviewer om te bevestigen dat de opgegeven licentie geldig is. Zie Category:License review needed voor meer instructies.
|
Copyright
© 2021, Guillot et al.
This article is distributed under the terms of the Creative Commons Attribution License, which permits unrestricted use and redistribution provided that the original author and source are credited.
Licentie
- De gebruiker mag:
- Delen – het werk kopiëren, verspreiden en doorgeven
- Remixen – afgeleide werken maken
- Onder de volgende voorwaarden:
- naamsvermelding – U moet op een gepaste manier aan naamsvermelding doen, een link naar de licentie geven, en aangeven of er wijzigingen in het werk zijn aangebracht. U mag dit op elke redelijke manier doen, maar niet zodanig dat de indruk wordt gewekt dat de licentiegever instemt met uw werk of uw gebruik van zijn werk.
Bestandsgeschiedenis
Klik op een datum/tijd om het bestand te zien zoals het destijds was.
| Datum/tijd | Miniatuur | Afmetingen | Gebruiker | Opmerking | |
|---|---|---|---|---|---|
| huidige versie | 1 mei 2024 22:32 | | 2.113 × 1.581 (1,21 MB) | Rasbak | {{Information |description= Fig. 1. Characterization of the SOX2/T-positive territory of the epiblast.<br> (A–C) Whole-mount embryos and (E, F) transverse cryosections showing the immunolocalization of SOX2 (A), T (B), T and SOX2 (C, E), and MSGN1 (F) in chicken embryos at stage 5HH. (D) Schematic representation of the expression of T (blue: high; green: low), SOX2 (red), and SOX2/T (gold) in a stage 5HH chicken embryo. The level of the tissue sections in (E, F) is shown with dashed double ar... |
Bestandsgebruik
Dit bestand wordt op de volgende pagina gebruikt: