
Bestand:Economics Gini coefficient2.svg

Afmetingen van deze voorvertoning van het type PNG van dit SVG-bestand: 500 × 500 pixels Andere resoluties: 240 × 240 pixels | 480 × 480 pixels | 768 × 768 pixels | 1.024 × 1.024 pixels | 2.048 × 2.048 pixels.
Oorspronkelijk bestand (SVG-bestand, nominaal 500 × 500 pixels, bestandsgrootte: 2 kB)
| Dit is een bestand van Wikimedia Commons. Onderstaande beschrijving komt van de beschrijving van het bestand daar. |
Beschrijving
| Beschrijving |
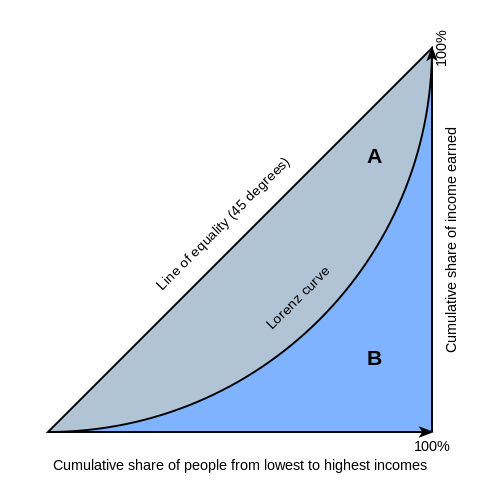
English: Gini coefficient diagram, based on the version by Bluemoose/BenFrantzDale. You can think of the horizontal axis as percent of people and the vertical axis as the percent of income those people receive. Therefore the Lorenz curves always start and end at the same places, where 0% of people make 0% of the country's income and 100% of people make 100% of the total income.
Inequality is implied when the curve is below the 45-degree line: At the left, the percentage of people is higher than the percent of income they receive (i.e. 10% of the people getting 5% of the total income); at the right, the percent of income received rises more than the percent of people receiving it. The area above the Lorenz curve -- marked "A" -- is shaded differently from the area below the curve -- marked "B". This simplifies the mathematical explanation of the gini coefficient, which is A/(A+B) |
| Datum | |
| Bron | The original file was on WikiMedia Commons (http://en.wikipedia.org/wiki/File:Economics_Gini_coefficient.svg). I have edited the file. |
| Auteur | Reidpath |
| Andere versies | Afgeleide werken van dit bestand: Economics Gini coefficient2-ar.svg |
Licentie
Deze afbeelding van tekst komt niet in aanmerking voor bescherming vanwege het copyright en bevindt zich dus in het publiek domein omdat de tekst uitsluitend uit informatie bestaat die gemeenschappelijk eigendom is zonder voldoende creatief auteurschap. Feiten, gegevens en de weinig originele informatie in een algemeen lettertype of geschreven met een basishandschrift, en eenvoudige geometrische vormen worden niet beschermd door het auteursrecht.
Noot: Deze tag is niet van toepassing op alle afbeeldingen met tekst. De juridische definitie van "literair werk" verschilt van land tot land en de mate waarin tekst beschermd is door het auteursrecht verschilt eveneens, evenals de interpretatie door de rechterlijke macht. In sommige landen is bijna elk geschreven werk beschermd, terwijl andere landen specifiek artistieke en wetenschappelijke teksten beschermen, evenals databases. De mate van creativiteit, functie en de lengte van de tekst kan daarbij relevant zijn. Het auteursrecht kan beperkt zijn tot de literaire vorm, terwijl de informatie zelf mogelijk niet beschermd is. |
Bestandsgeschiedenis
Klik op een datum/tijd om het bestand te zien zoals het destijds was.
| Datum/tijd | Miniatuur | Afmetingen | Gebruiker | Opmerking | |
|---|---|---|---|---|---|
| huidige versie | 6 mrt 2021 20:00 | | 500 × 500 (2 kB) | Nyq | decapitalized common nouns |
| 20 mrt 2016 18:52 |  | 500 × 500 (2 kB) | Wylve | Fixed CSS | |
| 20 mrt 2016 18:51 |  | 500 × 500 (2 kB) | Wylve | Reduce tracing artifacts | |
| 24 jun 2009 17:18 |  | 500 × 500 (7 kB) | Reidpath | {{Information |Description={{en|1=Gini coefficient diagram, based on the version by Bluemoose/BenFrantzDale. You can think of the horizontal axis as percent of people and the vertical axis as the percent of income those people receive. Therefore the Loren |
Bestandsgebruik
Dit bestand wordt op de volgende pagina gebruikt:
Globaal bestandsgebruik
De volgende andere wiki's gebruiken dit bestand:
- Gebruikt op af.wikipedia.org
- Gebruikt op ar.wikipedia.org
- Gebruikt op bh.wikipedia.org
- Gebruikt op bn.wikipedia.org
- Gebruikt op en.wikipedia.org
- Gini coefficient
- Lorenz curve
- Poverty
- Portal:Mathematics/Featured picture archive
- Wikipedia:Reference desk/Archives/Humanities/2010 December 18
- Portal:Mathematics/Featured picture/2012 08
- Wikipedia:Village pump (technical)/Archive 106
- Portal:Mathematics/Selected picture
- Portal:Mathematics/Selected picture/11
- User:Lexsta/sandbox
- Gebruikt op et.wikipedia.org
- Gebruikt op fa.wikipedia.org
- Gebruikt op he.wikipedia.org
- Gebruikt op it.wikipedia.org
- Gebruikt op ja.wikipedia.org
- Gebruikt op km.wikipedia.org
- Gebruikt op la.wikipedia.org
- Gebruikt op ms.wikipedia.org
- Gebruikt op ro.wikipedia.org
- Gebruikt op si.wikipedia.org
- Gebruikt op sq.wikipedia.org
- Gebruikt op sr.wikipedia.org
- Gebruikt op te.wikipedia.org
- Gebruikt op ur.wikipedia.org