Bestand:Ukrainian parliamentary election, 2007 (Percentage).PNG

Pagina-inhoud wordt niet ondersteund in andere talen.
Uit Wikipedia, de vrije encyclopedie

Ukrainian_parliamentary_election,_2007_(Percentage).PNG(768 × 477 pixels, bestandsgrootte: 10 kB, MIME-type: image/png)


Beschrijving

Beschrijving
Datum
Bron Self-made based off map by Muumi with data from Central Election Commission of Ukraine
Auteur User:DemocracyATwork
Toestemming
(Hergebruik van dit bestand)
w:nl:Creative Commons
naamsvermelding Gelijk delen
Dit bestand is gelicenseerd onder de Creative Commons-licentie Naamsvermelding-Gelijk delen 1.0 Unported
Naamsvermelding: DemocracyATwork
De gebruiker mag:
  • Delen – het werk kopiëren, verspreiden en doorgeven
  • Remixen – afgeleide werken maken
Onder de volgende voorwaarden:
  • naamsvermelding – U moet op een gepaste manier aan naamsvermelding doen, een link naar de licentie geven, en aangeven of er wijzigingen in het werk zijn aangebracht. U mag dit op elke redelijke manier doen, maar niet zodanig dat de indruk wordt gewekt dat de licentiegever instemt met uw werk of uw gebruik van zijn werk.
  • Gelijk delen – If you alter, transform, or build upon this work, you must distribute the resulting work under the same license as the original.
Andere versies

Collection

Results of the parliamentary elections:
Politcal alignment 2007
Vote percenatge 2006 to 2007 (Top Six parties)
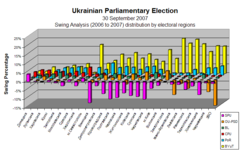
Swing 2006 to 2007 (Top Six parties)

Regional Analysis of the parliamentary elections:

Highest Vote per region
Charts showing the top six parties support - percentage of total national vote and Electoral Region
Vote Percentage by Electoral Region Vote Percentage by Electoral Region Swing by Electoral Regions
Maps showing the top six parties support - percentage of total national vote
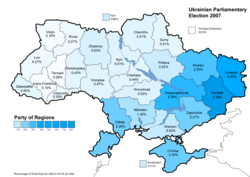
Party of Regions results (34.37%)
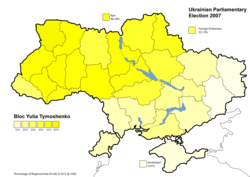
Bloc Yulia Tymoshenko results (30.71%
Our Ukraine People's Self-Defence results (14.15%)
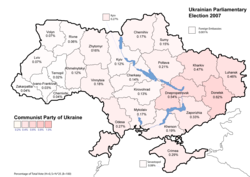
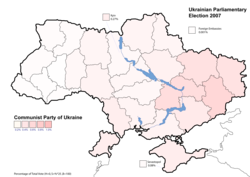
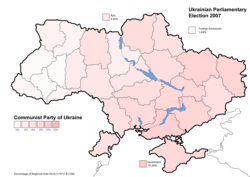
Communist Party of Ukraine results (5.39%)
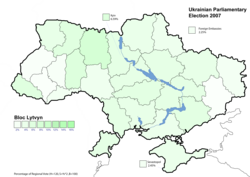
Bloc Lytvyn Party results (3.96%)
Socialist Party of Ukraine results (2.86%)
Maps showing the top six parties support - percentage of total national vote (Minimal text)
Party of Regions results (34.37%)
Bloc Yulia Tymoshenko results (30.71%
Our Ukraine People's Self-Defence results (14.15%)
Communist Party of Ukraine results (5.39%)
Bloc Lytvyn Party results (3.96%)
Socialist Party of Ukraine results (2.86%)
Maps showing the top six parties support - percentage per region
Party of Regions results (34.37%)
Bloc Yulia Tymoshenko results (30.71%
Our Ukraine People's Self-Defence results (14.15%)
Communist Party of Ukraine results (5.39%)
Bloc Lytvyn Party results (3.96%)
Socialist Party of Ukraine results (2.86%)


2007 [1] [2] [3] [4] [5] [6]

2006 [7] [8] [9] [10] [11] [12]

A swing analysis is common in any election. It shows the change in voter percentage for each party by regions from 2006 to 2007.

Licentie

Public domain Ik, de auteursrechthebbende van dit werk, geef dit werk vrij in het publieke domein. Dit is wereldwijd van toepassing.
In sommige landen is dit wettelijk niet mogelijk; in die gevallen geldt:
Ik sta iedereen toe dit werk voor eender welk doel te gebruiken, zonder enige voorwaarden, tenzij zulke voorwaarden door de wet worden voorgeschreven.
  1. Template:Cite gov
  2. Template:Cite gov
  3. Template:Cite gov
  4. Template:Cite gov
  5. Template:Cite gov
  6. Template:Cite gov
  7. Template:Cite gov
  8. Template:Cite gov
  9. Template:Cite gov
  10. Template:Cite gov
  11. Template:Cite gov
  12. Template:Cite gov

Bijschriften

Beschrijf in één regel wat dit bestand voorstelt

Items getoond in dit bestand

beeldt af

Bestandsgeschiedenis

Klik op een datum/tijd om het bestand te zien zoals het destijds was.

Datum/tijdMiniatuurAfmetingenGebruikerOpmerking
huidige versie20 feb 2008 19:04Miniatuurafbeelding voor de versie van 20 feb 2008 19:04768 × 477 (10 kB)DemocracyATworkUkrainian Parliementary Election 2007 Results of election (Top six parties percentage) chart. Removed boarder.
18 feb 2008 01:06Miniatuurafbeelding voor de versie van 18 feb 2008 01:06460 × 273 (7 kB)DemocracyATworkUpdate to reflect color change for Bloc Lytvyn to match with the Parliamentary seat allocation map. From grey to geen.
12 feb 2008 20:23Miniatuurafbeelding voor de versie van 12 feb 2008 20:23460 × 273 (8 kB)DemocracyATwork{| class="wikitable" |- |+ Results of the parliamentary elections: |- | 250px|center|Politcal alignment 2007 | [[Image:Ukrainian parliamentary election, 2007 (Percentage).PNG|250px|center|Vote

Dit bestand wordt op de volgende pagina gebruikt:

Globaal bestandsgebruik